
Move and Resize your Chart
You might find that your chart from the previous lesson is covering your data. In the image below, our chart is overlapping the ITV data. To move it, hold your mouse over the chart until your cursor changes shape: (We found that the best place for your mouse is over the dots in Excel 2007, as we had problems moving a chart when the cursor was anywhere else! Moving charts in later versions of Excel is easier.)

Press and hold down the mouse button when your cursor looks like the one in the image above, and then drag your chart to a new location. In the image below, we've placed the chart below the data.

You can also place your chart in a different worksheet. To do this in Excel 2007, right click anywhere on your chart. From the menu, select Move Chart:

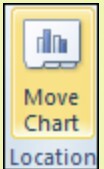
In Excel 2010 and 2013 there is a Locationpanel to the right of Chart Styles. Click theMove Chart item:
In all versions, you'll then get a dialogue box popping up:

If you want your chart in a new worksheet, select the first option. Then delete the text "Chart1" from the textbox, and then type a name of your own.
If you look along the bottom of Excel , you'll see Sheet1, Sheet2, and Sheet3. Your data is in Sheet1. If you click the drop down list to the right of Object in on the dialogue box above, you'll see the other worksheets you have open. You can select one from the list and click OK. But for this first chart, leave it in Sheet1.
How to Resize an Excel Chart
You can resize a chart, and any elements on it, by moving your mouse over the sizing handles. For the chart itself, the sizing handles are the dots around the edges of the chart in Excel 2007:

In later versions, the sizing handles are white squares:

When your mouse changes shape to a double-headed arrow, hold down your left mouse button. Then drag to a new location. You can resize using the corners, or the edges..
In the next part, you'll see how to use Chart Styles and Chart Layouts in Excel.
Buy Complete M.S. Excel Tutorial Book From Amazon : https://amzn.to/2yEYXgk
Buy Complete M.S. Excel Tutorial Book From Amazon : https://amzn.to/2yEYXgk


0 Comments
Please share your opinions and suggestions with us.